Some common opinions of high yields:
"High yields are bad for the environment"
"Extra input costs would cancel out extra returns"
"Growing high yielding crops is too risky"
"High yields have a high C footprint"
"Minimising ipnut costs is a better target than high yield"
But what does the YEN data tell us?
Calculating gross margins & C footprints of YEN data
Over 1,200 wheat yields have been collected between 2013 and 2022 harvest years with hundreds of explanatory metrics. (e.g. Agronomic inputs, seed rate, variety group, cultivations, weather data...). This data has been used to calculate crop input costs (variable costs), output value (weight of grain x feed or milling value), and crop GHG emissions. From this data, we can compare across YEN entries to look at the impact of yield on gross margins and carbon footprints. To calculate gross margins, fixed assumptions have been used for input and output costs and for crop carbon footprints emissions factors and UK greenhouse gas inventory methodologies have been applied.
YEN variable costs & gross margin
The data showed that gross margins (£/ha) were strongly and positively related to grain yield.
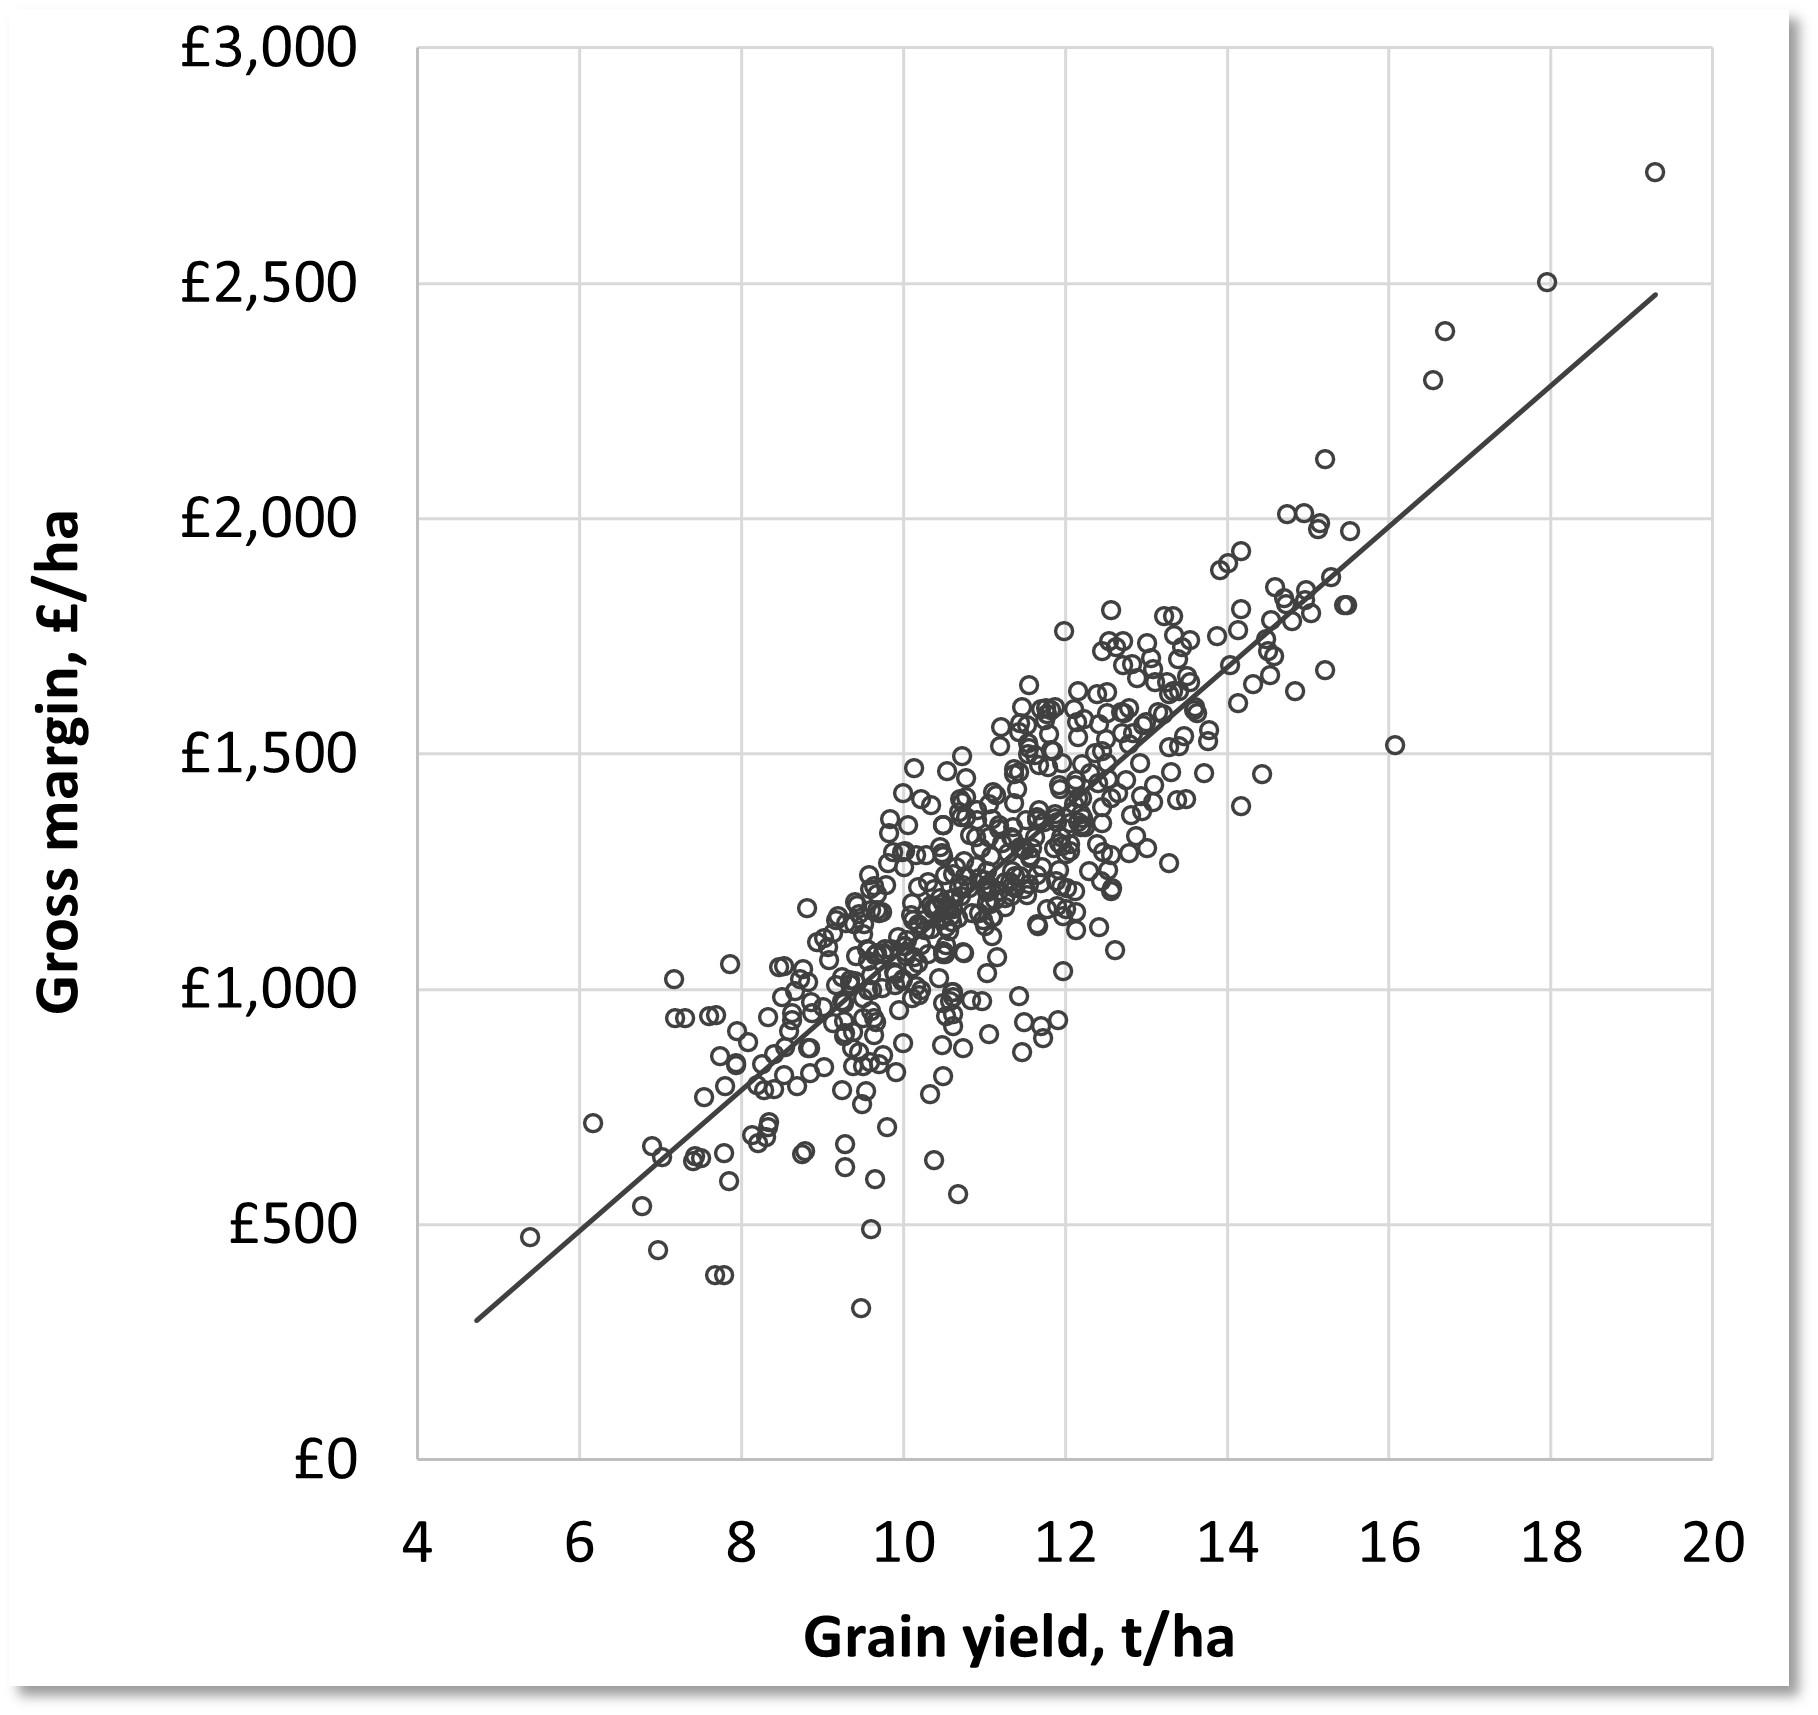
On average less than 3 t/ha of grain yield paid for average inputs (5t/ha for big spenders). On average an 8 t/ha yielding crop had a gross margin of £800/ha and 12 t/ha had a gross margin of £1,400/ha. A farm's fixed costs (rent, staff, buildings, machinery) will eat into these margins so quoted profits will be lower. There was little association between yield and variable costs, indicating high YEN yields weren’t achieved from high inputs. Instead high variable costs were associated with repeated fungicide and herbicide applications or attempts to fix P and K soil indices.
YEN Wheat crop carbon footprints
See the below pie chart for a breakdown of YEN wheat crop carbon footprints
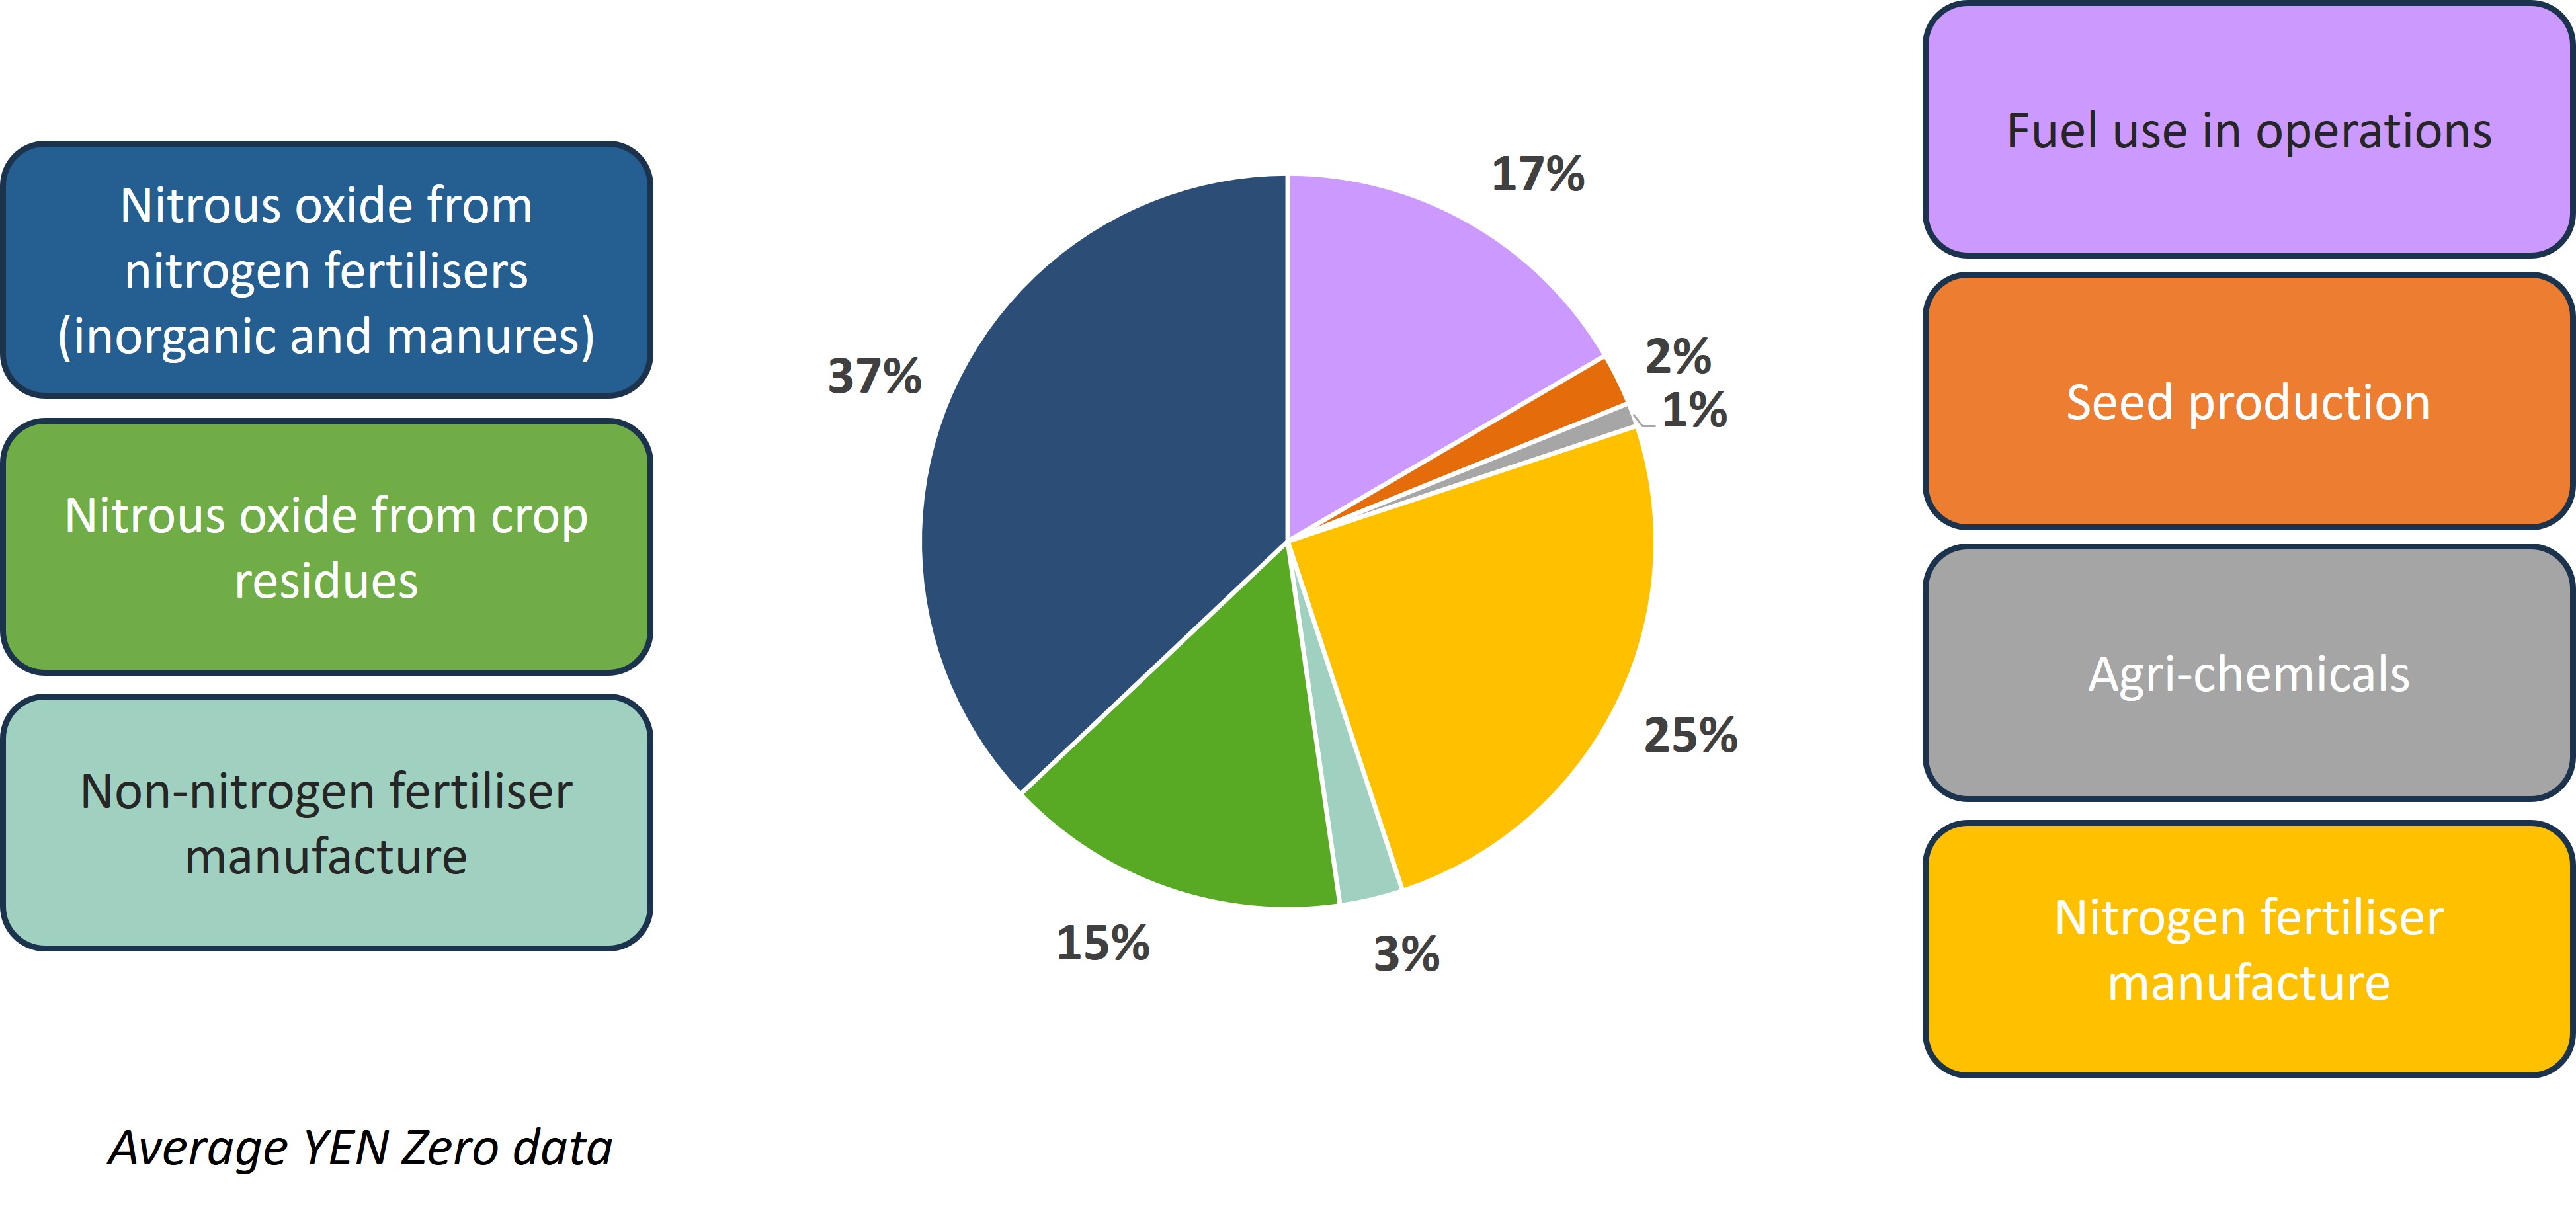
YEN Wheat crop carbon footprints /ha
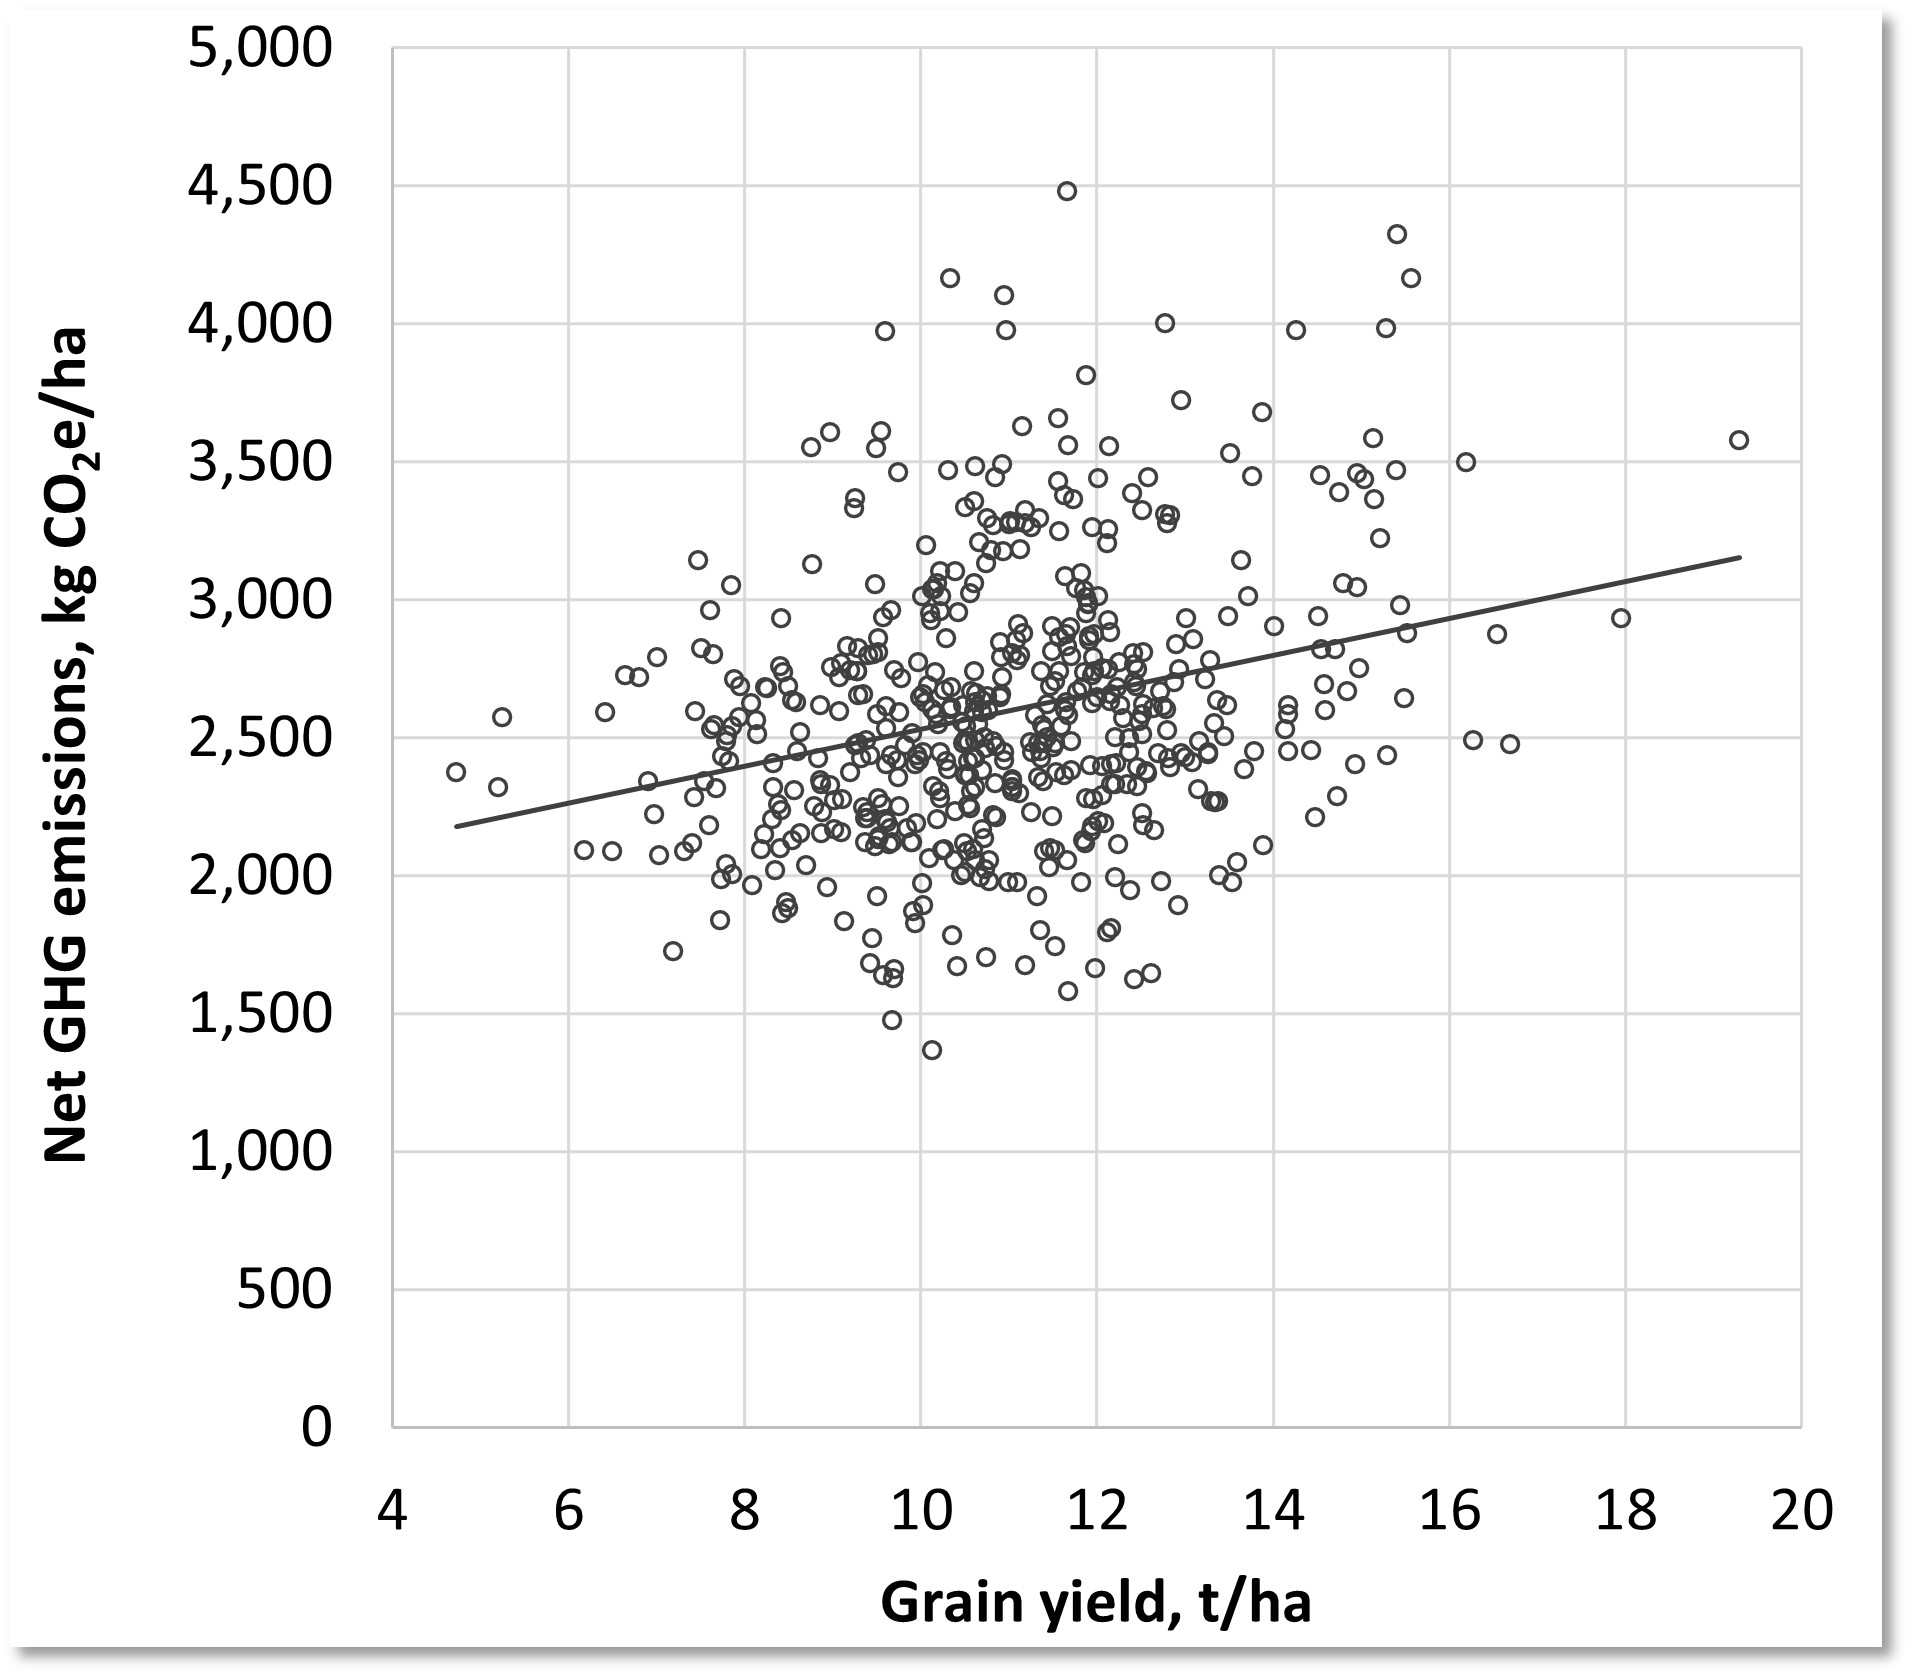
YEN data shows that higher yielding crops had slightly greater carbon footprints per hectare. This is due to a modest increase in N input and a greater quantity of crop residue left in the field. The relationship is variable, indicating multiple high yield crops didn't necessarily have high C footprints, indicating high yields with moderate C footprints/ha are achievable with smart management.
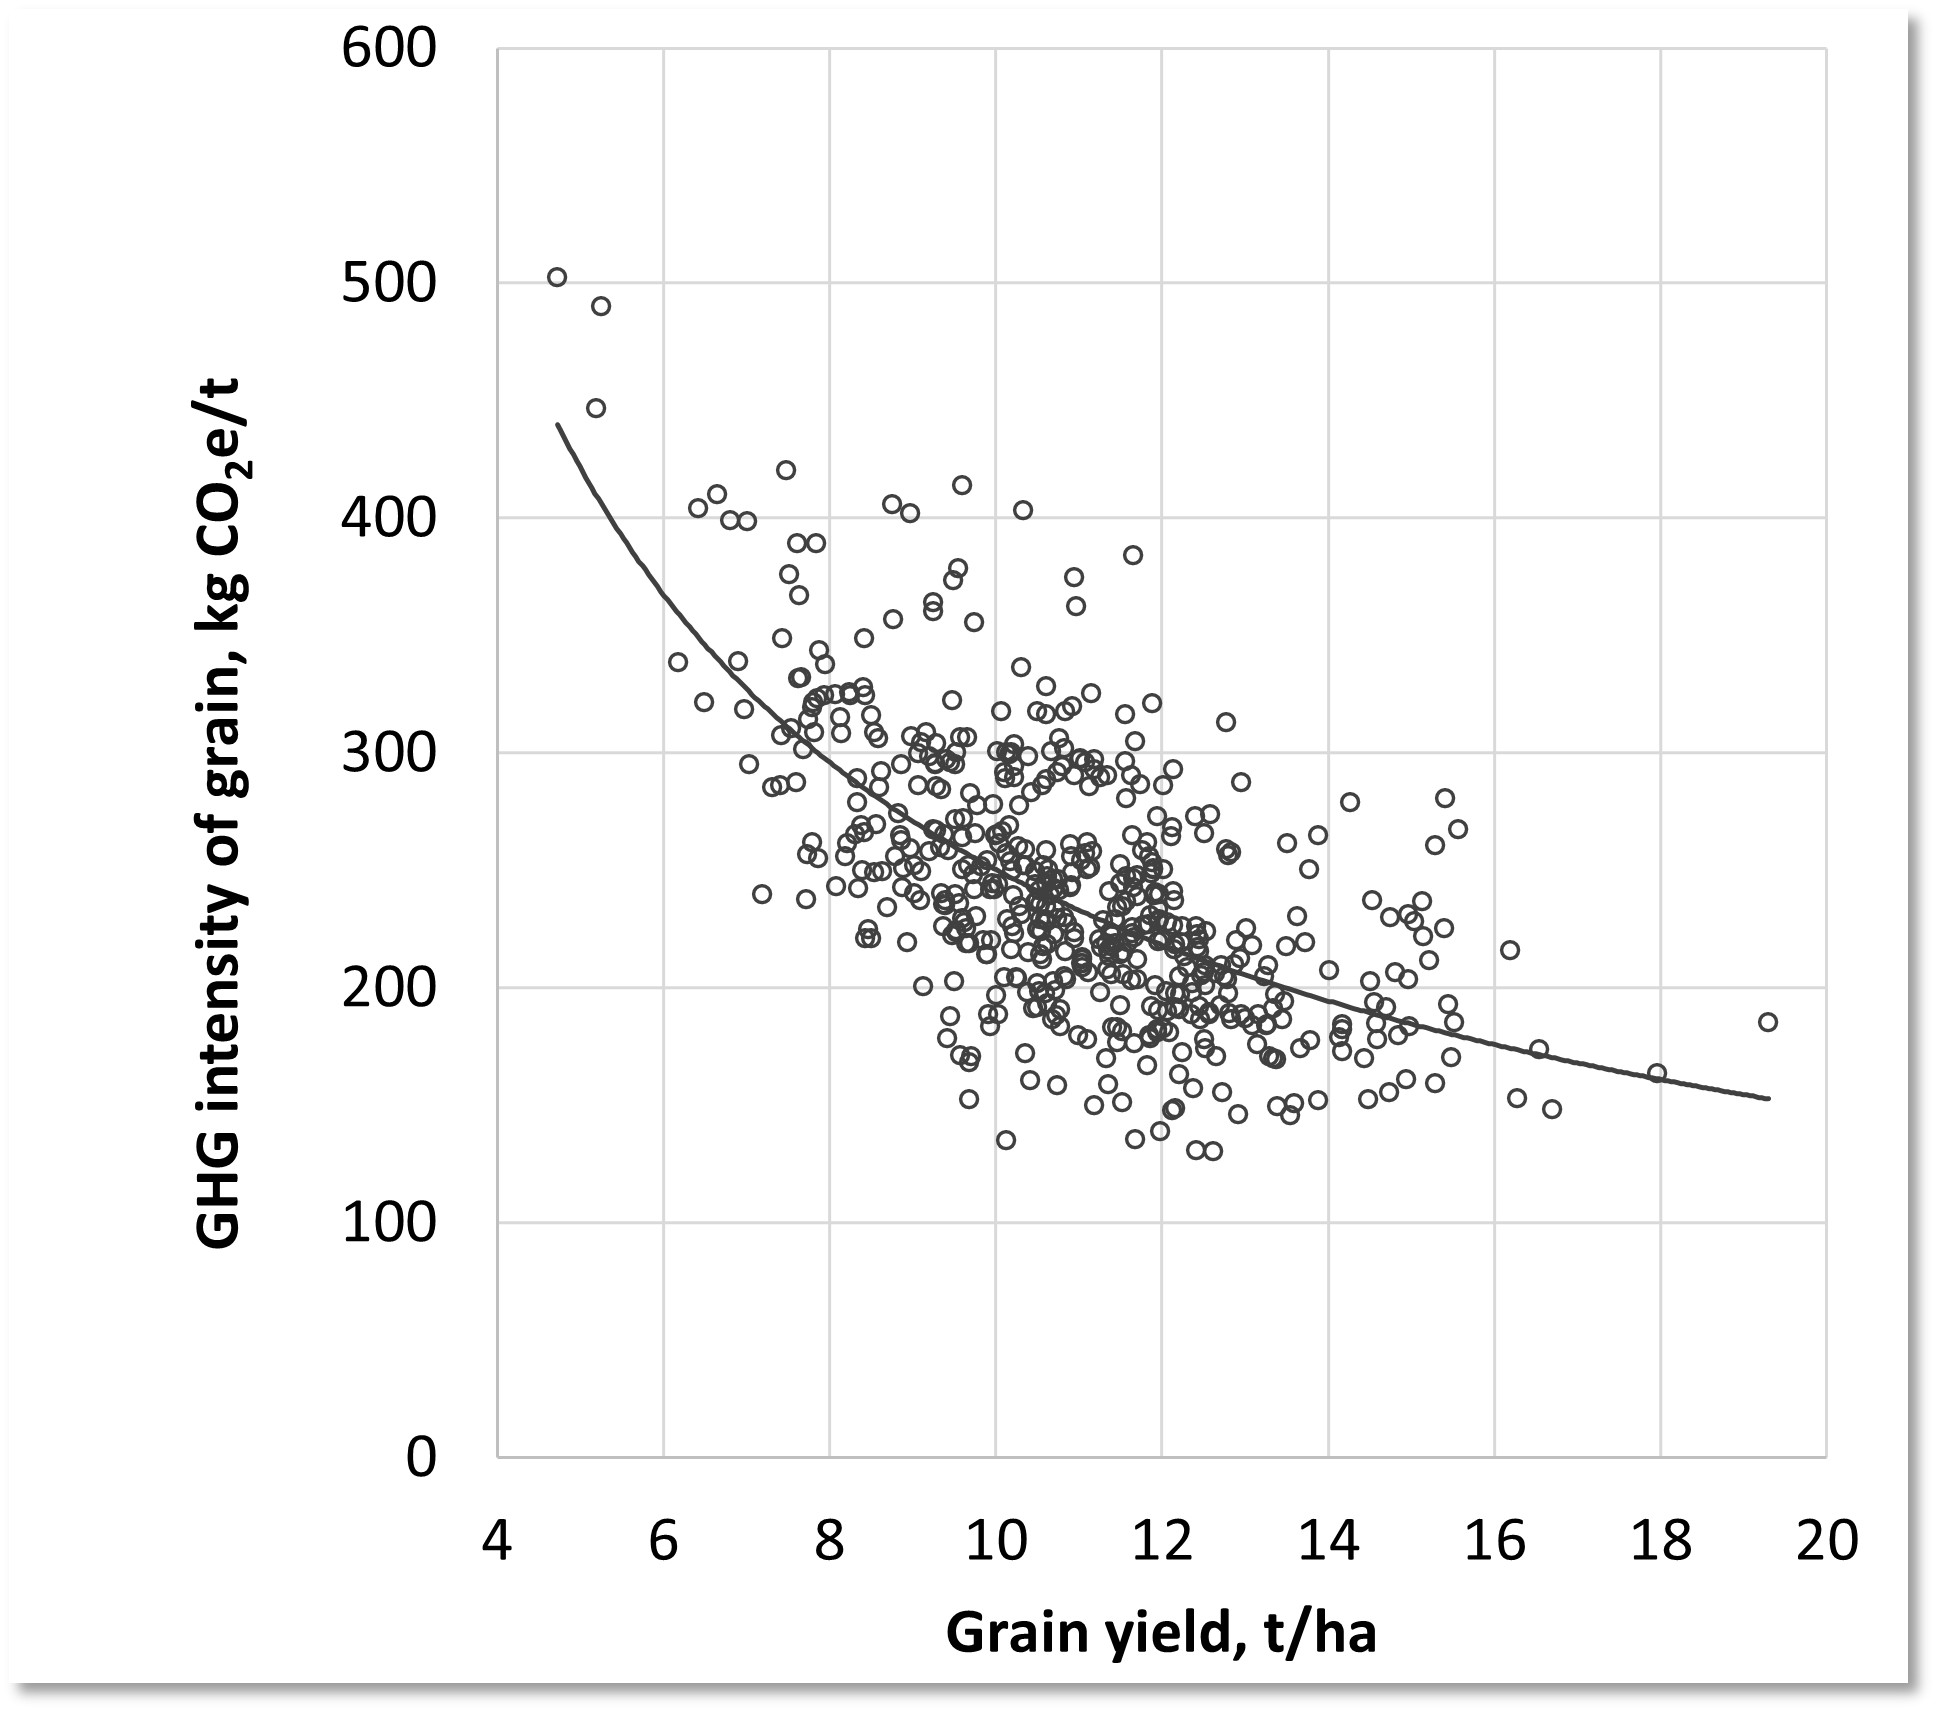
YEN Wheat crop carbon footprints /tonne
The analysis of YEN data found that high yields reduced GHG intensities (Carbon footprint/tonne) of average yielding crops by a third. This association would be greater if Indirect Land Use Change (ILUC) impacts were considered. This is the change in land use required to make up for lost outputs of reduced yields.
N balance of high yielding crops
The YEN data showed that high yields only had a weak positive relationship with N applied. The N balance became increasingly negative as yield increased: 13 kg N/tonne of yield.
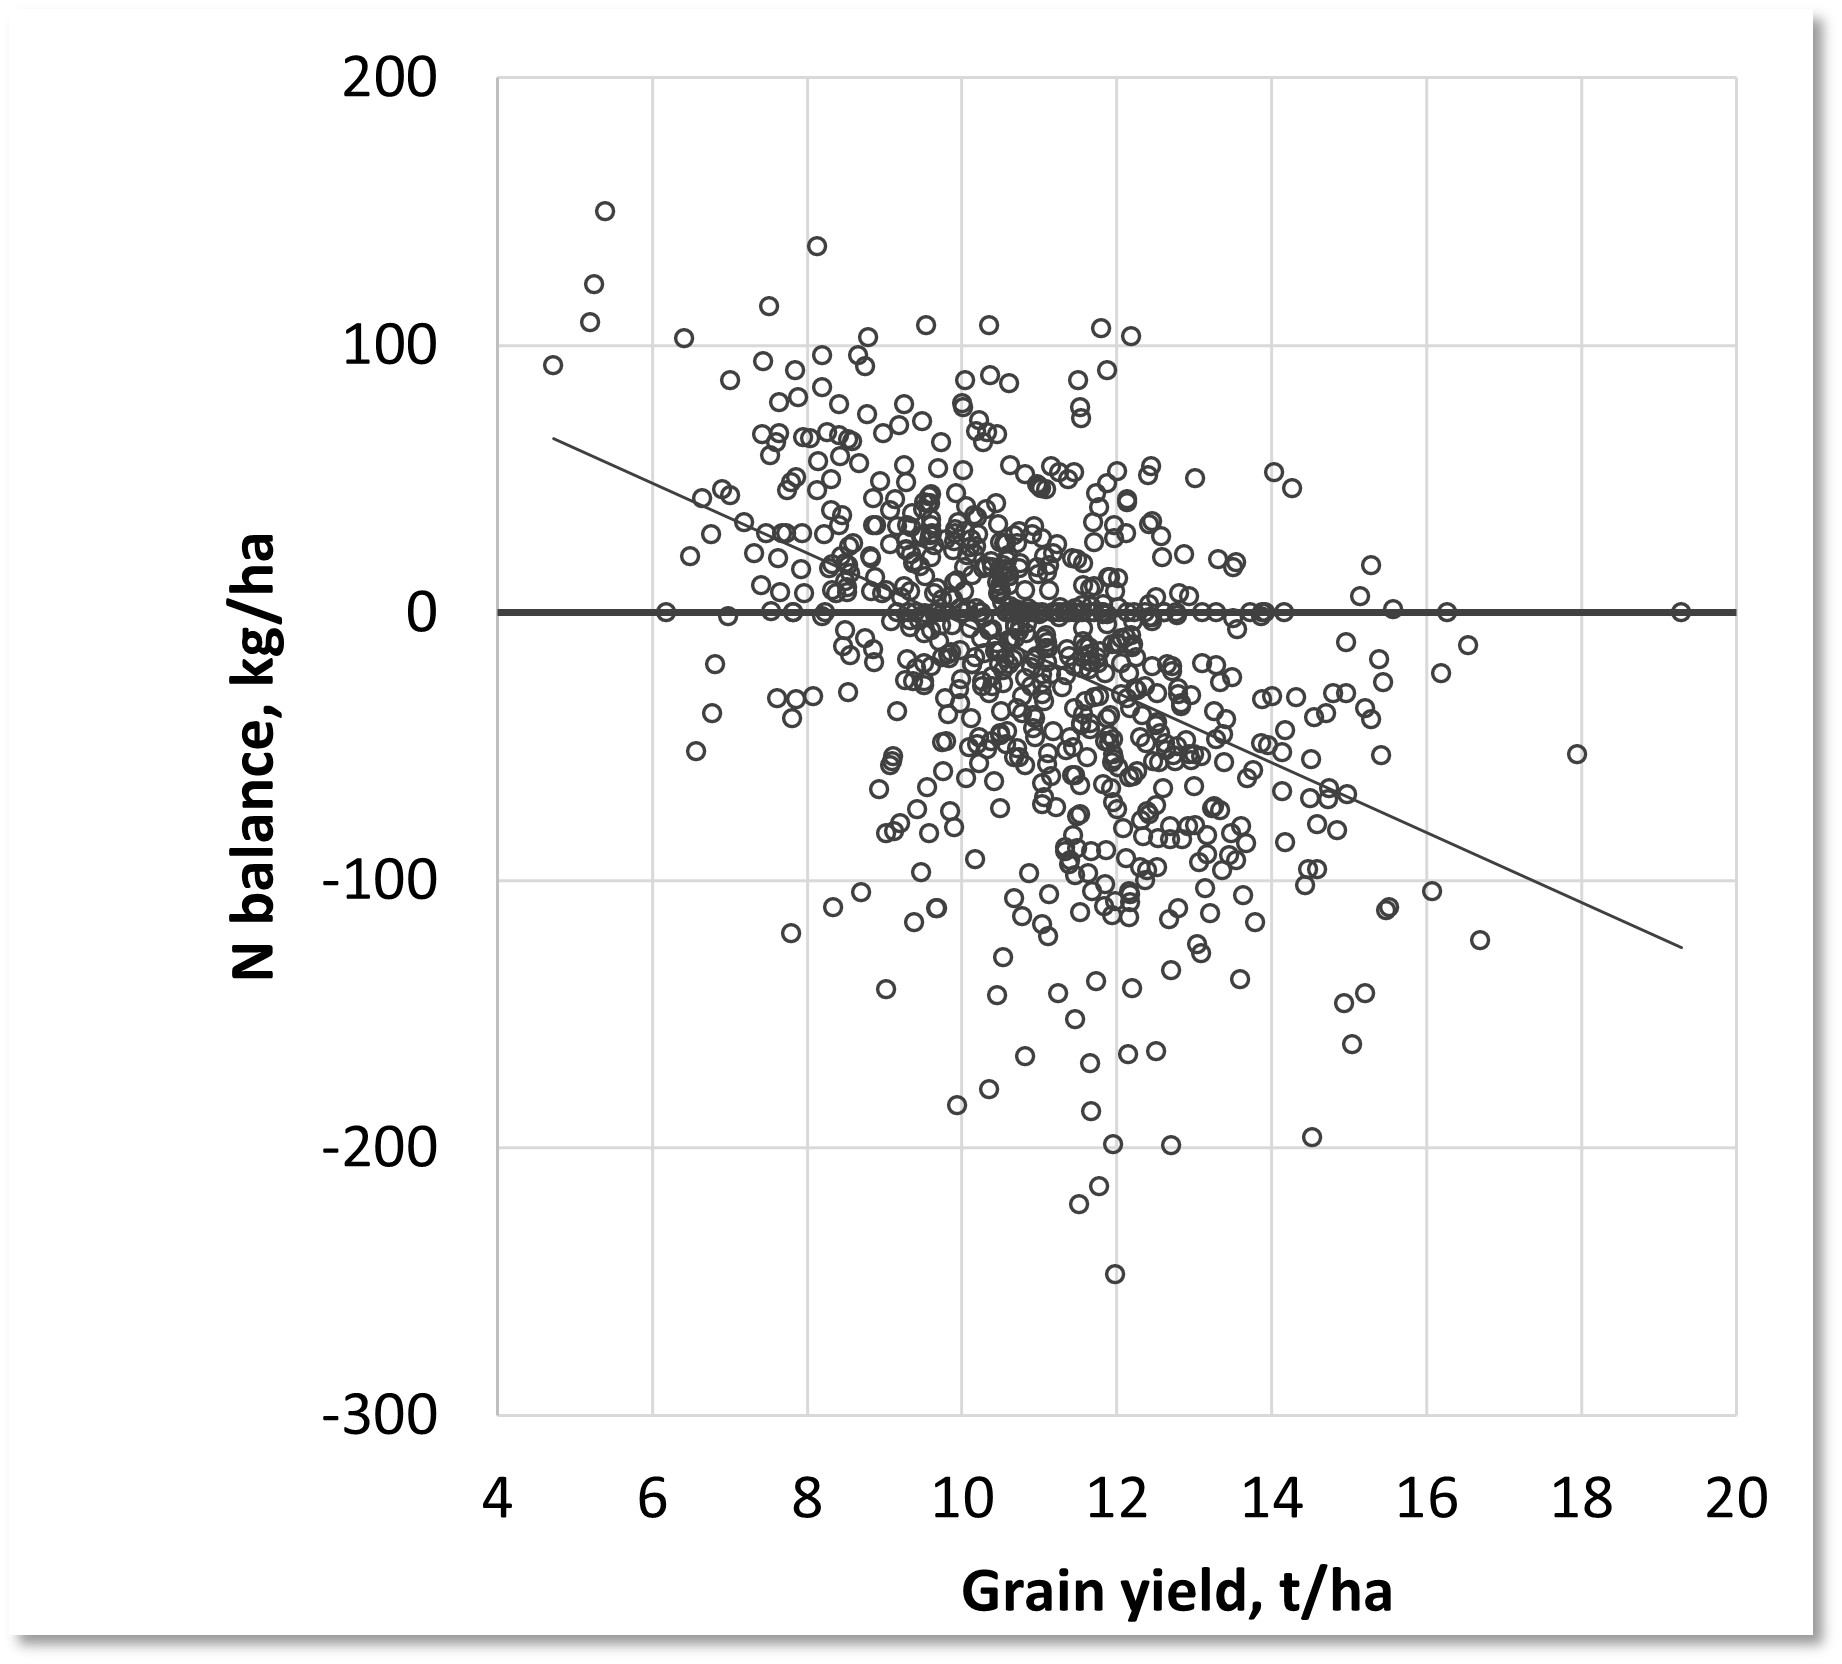
This means in practice high yielding crops are effective at capturing N from non-synthetic sources (e.g. soil N, organic materials and previous crop residues. As a result, we need to ensure negative N balances are addressed for following crops.
The UK needs more targeted land use policy
- High agricultural productivity is needed to feed our growing population. If output declines, land conversion is required: a high emitter of GHG emissions.
- The least productive 20% of our land produces 3% of our calories. This land can be used to support wildlife, plant woodlands and restore peat bogs. If we properly incentivise farmers on this less productive land to make environmental projects more attractive than conventional farming, we could meet the Government's targets for both carbon sequestration and nature restoration. Most of this land could still be used for low intensity farming. We calculate that only 5%-8% of our total farmland would need to be freed from production almost entirely, largely to plant broadleaf woodland and restore peat bogs.
- The remaining 80% high yielding land covers 55% of our surface area.
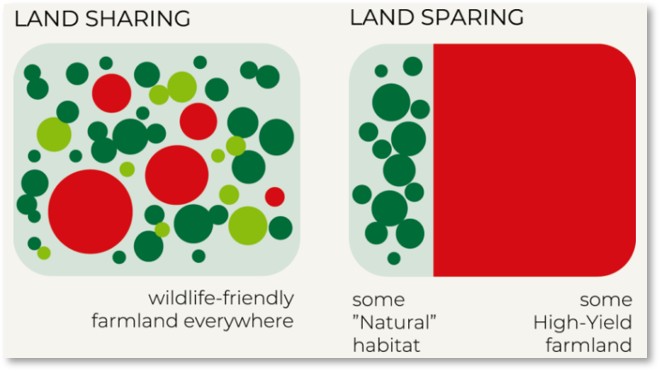
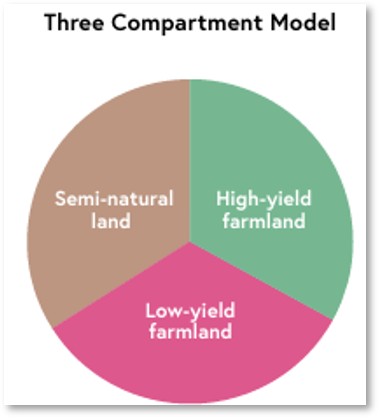
Land sparing vs land sharing
The land sparing vs land sharing debate focuses on the most optimal land use strategy. The Three Compartment Model allows for more nuance. In terms of biodiversity some species thrive under low intensity habitats, while others require wild habitats. As previously mentioned, maintaining high yields on highly productive land makes environmental and economic sense. It is therefore, not as simple as land sparing vs land sharing. An optimal combination of land-use strategies will vary spatially, requiring place-based approaches rather than uniform national policies. Models indicate regional change recommendations, but changes can also occur at smaller scales - within fields. Something to consider on your farms.
Current activity to reduce agriculture's carbon footprint
The All-Party Parliamentary Group on Science and Technology in Agriculture published the Feeding Britain Sustainably to 2050: The 30:50:50 Mission report in 2025. The mission outlined is to increase UK agriculture's productivity by 30% by 2050 while reducing environmental footprint by 50%.
- 60% land allocating to high yield farming
- 25% to natural habitat
- 15% to low intensity farming
Government support is available for commercially viable options for farming on rewetted peatlands.
Tools are available for optimal farmland use planning. E planner and Lumeo are two examples of such tools.
Yield is king... in the right contexts
- YEN data indicates high yields don't necessarily mean high inputs
- High yields had greater gross margins (£/ha) and lower GHG intensities (kg CO2e/tonne)
- High yielding crops were more effective at capturing N from non-synthetic sources
- Productivity is essential for food security and allows more land area to be used for semi-natural habitats and low intensity farming
- But context is important to ensure the right land use in the right place